Free Calculator and Whitepaper

Understand the environmental impact of your organisation’s AI use

AI use is becoming part of everyday work, but its environmental impact is rarely included in organisational reporting. This calculator provides an estimate of the electricity, water and carbon emissions associated with AI use, based on your organisation’s number of employees, adoption and daily AI queries.

  • Designed for organisations to estimate AI use across your workforce
  • Calculate electricity, water and carbon impacts at organisation and employee level
  • Peer-reviewed estimates of AI energy use alongside UK carbon and water factors
  • Download a PDF report to support your Scope 3 assessment

Free to use. Results are generated in your browser and take around two minutes.

ESTIMATED IMPACT OF ONE MEDIUM AI QUERY

A single medium AI prompt

Electricity 4.7Wh
Water 22mL
Carbon 0.68g CO2e
Results across 40 AI users sending 17 queries a day, 253 working days a year: 102 kg CO2e plus 703 kWh and 3,305 litres of water, every year.

Cross provider averages from arXiv:2505.09598, applied with UK carbon factors. Illustrative only.

AI Carbon Impact Calculator | Climate Essentials
Climate Essentials
Organisation AI impact report
The environmental impact of AI use at work
Company name-
Total employees-
Employees using AI-
Impact period covered-
Date of report-
Calculations byClimate Essentials™

See your organisation's AI footprint

Enter your email to unlock the calculator. Takes about two minutes.

1Who uses AI
2How much they use it
3Your impact

How many of your people use AI?

Emissions from AI scale with the number of people using it. Start with your headcount, then tell us how many of them are active AI users.

Enter a headcount of at least 1.

Sector adoption rates come from the EY 2024 Work Reimagined Survey. They are a starting point, not a measurement of your organisation.

How much do they use it?

Step 1 gave us the reach of AI in your organisation. This step captures the intensity: how many queries get sent on a typical working day.

Simple: a short prompt and a short answer, such as a definition or a quick email. Roughly 1 to 2 sentences in.
Medium: a longer piece of work, such as drafting a report section or reviewing a document. Around 750 words in and 750 words out.
Complex: a heavy task, such as analysing a long report or a large dataset. Around 7,500 words in and 1,100 words out.

Enter at least one query.

Your AI impact

These figures cover the inference phase only: the electricity and water used when your people send queries and models generate answers.

Results

Electricity
0kWh
Water
0litres
Carbon
0kg CO2e

Methodology and scope

This calculator estimates the environmental impact of the inference phase of AI use: the electricity and water consumed in the data centre each time one of your employees sends a query and a model generates a response.

Included
  • Data centre electricity used to process employee queries
  • Transmission and distribution losses on that electricity
  • Water consumed at the data centre and at the power stations supplying it
  • Carbon associated with supplying that water
Not included
  • Model training: the energy used by developers to build the models
  • Embodied carbon of servers, GPUs, buildings and network hardware
  • Employee devices, office electricity and network transport
  • AI embedded in software you use indirectly, such as search or recommendation engines
  • Wastewater treatment, where water is returned to sewer rather than evaporated

Where the numbers come from

  • Energy and water per query: averaged across eight major model providers, from arXiv:2505.09598. We apply the cross-provider average: about 3.3 Wh and 15 mL for a simple query, 4.7 Wh and 22 mL for a medium query, and 6.5 Wh and 31 mL for a complex query.
  • Electricity carbon factor: 0.14395 kg CO2e per kWh, being UK grid generation (0.13096) plus transmission and distribution losses (0.01299).
  • Water carbon factor: 0.1913 kg CO2e per cubic metre, water supply only. Treatment is excluded because evaporative cooling consumes water rather than discharging it to sewer.
  • Sector adoption rates: EY 2024 Work Reimagined Survey.
  • Working days: 253 per year, 20 per month, 5 per week.

What this means for your carbon accounting

Under the GHG Protocol these emissions are not a separate category. Electricity consumed in a third party data centre you do not own or control sits in Scope 3, Category 1 (purchased goods and services) as part of the AI service you buy, or Category 8 if you lease the infrastructure. If you already account for AI subscriptions on a spend basis, adding these figures on top would double count them.

How accurate is this?

Treat the output as an order of magnitude, not a reportable figure. The main sources of uncertainty are:

  • Per-query energy varies by more than five times between providers and models. A footprint calculated on the cross-provider average could be substantially wrong for an organisation standardised on one tool.
  • Where a query lands between simple, medium and complex is a judgement, and users are poor at estimating their own volumes.
  • UK grid factors are applied throughout, but inference may run in any region. A query served from a coal-heavy grid carries several times the carbon of one served from a low carbon grid.
  • Data centre water use depends on the cooling system and local climate, both of which vary widely.
  • Because training and hardware are excluded, the true lifecycle footprint of your AI use is higher than the figure shown.

Full method: The Carbon Impact of Artificial Intelligence: Implications for Business Footprints, Climate Essentials™ (2026).
© Climate Essentials™ 2026. All rights reserved. Prepared for the named organisation above. Figures are estimates for the AI inference phase only and are not a substitute for a full GHG inventory.
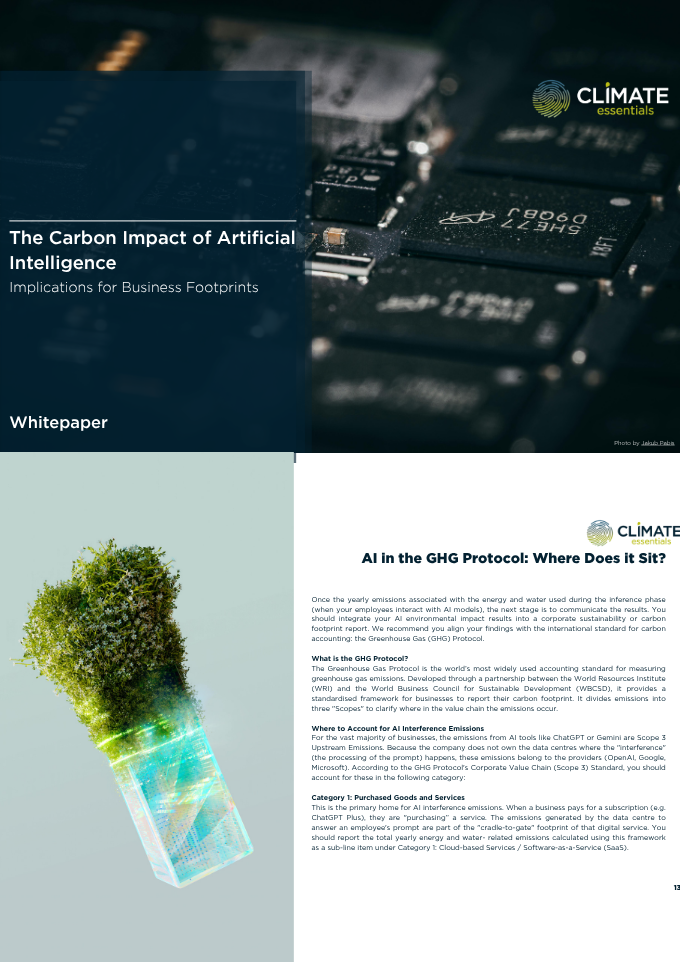
Cover of the Climate Essentials whitepaper on the carbon impact of artificial intelligence

Free whitepaper

The full methodology, free to download

This paper sets out the methodology, assumptions, and carbon factors used by Climate Essentials to develop this calculator. The report also has recommendations to help your business reduce the environmental impact of AI usage in the workplace.

The methodology

How per query energy and water figures are derived, and which carbon factors are applied to each.

The assumptions

What sits inside the boundary, what we have excluded, and where the numbers are least certain.

Where AI sits in Scope 3

How to treat AI use under the GHG Protocol without double counting it against your software spend.

Recommendations

Practical steps to cut AI related emissions, from model choice to query design and procurement terms.

PDF, free. We will email you the link and occasional updates on carbon reporting.